

What Is the MySchool Website?
The MySchool website (myschool.edu.au) is Australia's national school information portal, managed by the Australian Curriculum, Assessment and Reporting Authority (ACARA). Launched in 2010, it provides publicly available data on more than 10,000 Australian schools ÔÇö government, Catholic and independent ÔÇö across all states and territories.
For parents navigating the complex Australian education system, MySchool is an invaluable starting point. Whether you are choosing between a local public school and a nearby Catholic college, or moving to a new suburb and trying to understand your options, this platform gives you verifiable, comparable data in one place.
How to Search for a School
Getting started on MySchool is straightforward. Follow these steps:
- Go to myschool.edu.au and use the search bar at the top of the page.
- Enter a school name, suburb, or postcode.
- Refine your results by school type (primary, secondary, combined), sector (government, Catholic, independent), and state.
- Click on any school to view its full profile.
Each school profile is divided into several tabs: Overview, NAPLAN, Students, Staff, Finances, and Location. Each section contains its own insights, and understanding what each metric means is key to interpreting the data correctly.
Understanding the ICSEA Value
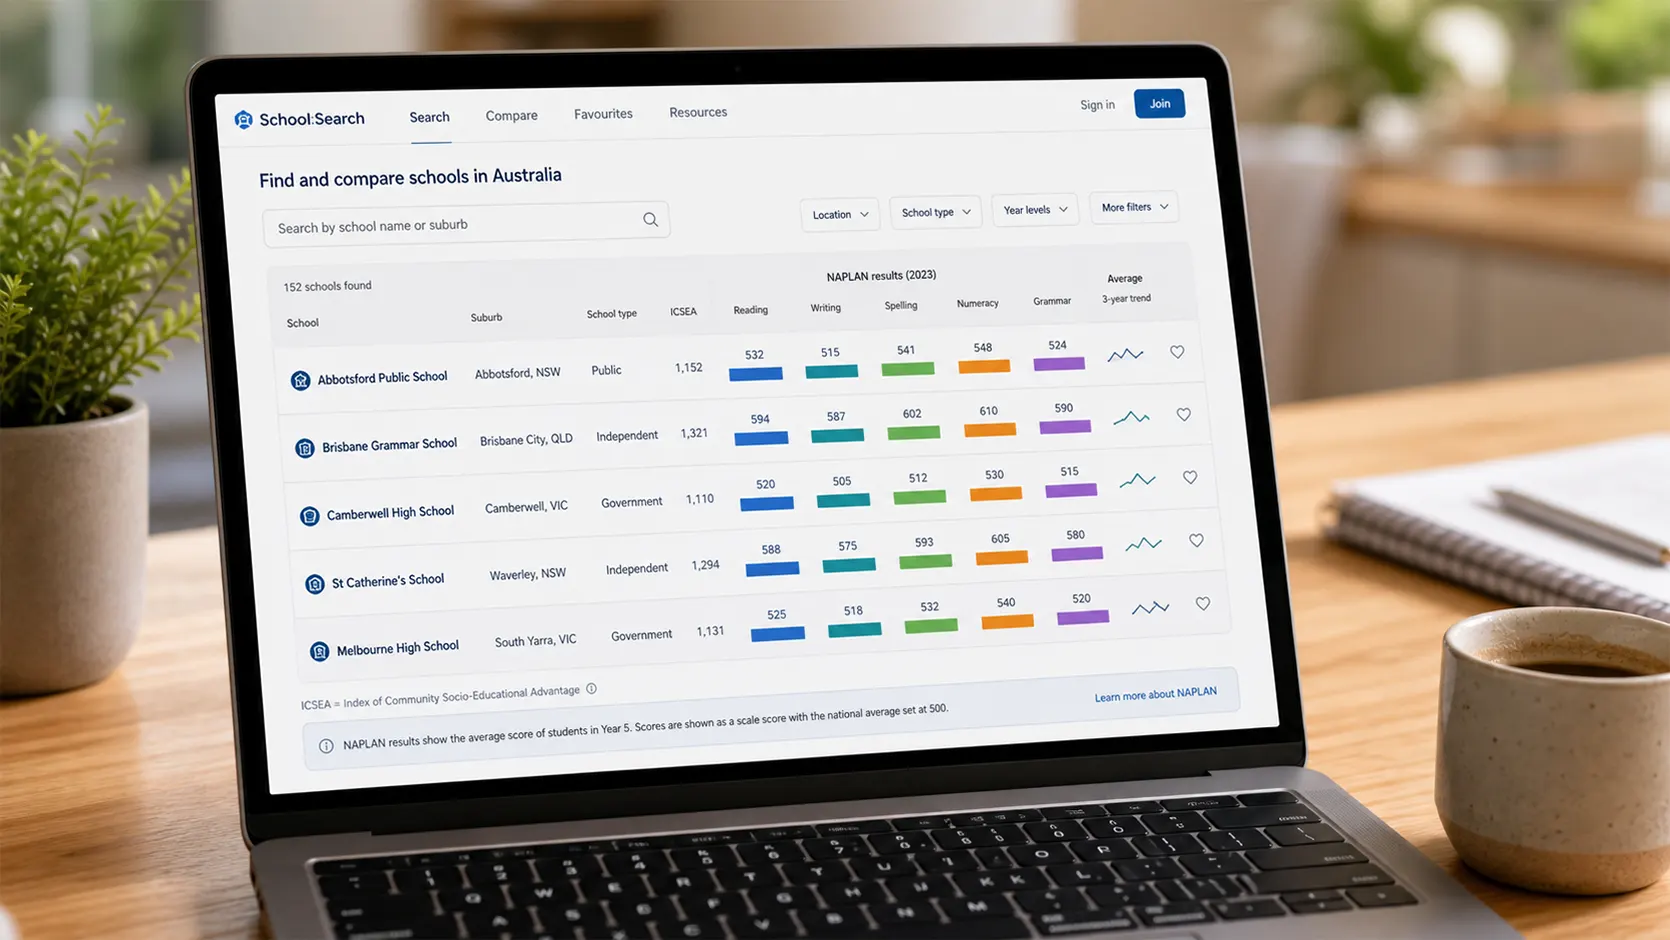
One of the most important ÔÇö and most misunderstood ÔÇö metrics on MySchool is the ICSEA (Index of Community Socio-Educational Advantage). This number reflects the relative educational advantage of the community from which a school draws its students. The national average is always set at 1,000.
- ICSEA above 1,000: The school draws from a more educationally advantaged community (higher parental education levels, higher incomes, access to resources).
- ICSEA below 1,000: The school serves a community with lower average socio-educational advantage.
- ICSEA does not measure school quality ÔÇö it measures the background of students. A school with an ICSEA of 900 may have excellent teachers delivering outstanding outcomes for its community.
When comparing schools on MySchool, always look at NAPLAN results relative to statistically similar schools, not just the raw scores. A school in a low-ICSEA community achieving "above similar schools" results is arguably performing better than a high-ICSEA school meeting similar results ÔÇö because it is achieving more with less.
Reading NAPLAN Results on MySchool
The NAPLAN tab is often the first place parents navigate, but the data requires careful interpretation. Here is how to read it correctly:
What Is Shown
NAPLAN results on MySchool display results for Year 3, Year 5, Year 7 and Year 9 students in five domains:
- Reading
- Writing
- Spelling
- Grammar and Punctuation
- Numeracy
How Results Are Displayed
From 2023, NAPLAN moved to a new proficiency scale with four levels:
- Exceeding: The student is performing well above the expected standard.
- Strong: The student is performing above the expected standard for their year level.
- Developing: The student is working towards the expected standard.
- Needs additional support: The student is not achieving the expected standard and may require targeted assistance.
MySchool presents the percentage of students in each proficiency level for each domain, allowing comparison with similar schools and all Australian schools.
How to Compare Fairly
Below every NAPLAN graph, MySchool provides two comparison bars:
- Statistically similar schools: Schools with a similar ICSEA band.
- All Australian schools: The national average.
Use the statistically similar schools comparison as your primary benchmark. If a school has significantly more students in the "Exceeding" and "Strong" categories than its similar peers, it is likely adding real academic value to its students.
The Students Tab: Enrolment and Attendance
The Students tab provides a demographic breakdown of the school community:
- Total enrolments and whether numbers are growing or shrinking
- Percentage of students from a Language Background Other Than English (LBOTE)
- Percentage of Aboriginal and Torres Strait Islander students
- Percentage of students with a disability
- Average attendance rate ÔÇö a key indicator of student engagement
Attendance rate is worth particular attention. Nationally, Australian schools aim for attendance rates above 90%. A school with consistent attendance rates of 95%+ generally indicates a positive school culture and engaged student body. Rates significantly below the national average may signal underlying issues worth investigating further.

The Staff Tab: Teacher Qualifications and Numbers
The Staff tab reveals information about the school's teaching workforce:
- Total number of staff (teaching and non-teaching)
- Full-time equivalents (FTE) for teachers and support staff
- Percentage of teachers who are fully qualified
- Percentage of teaching performed by teachers out of field
The out-of-field teaching percentage is particularly significant for secondary schools. If a high proportion of, say, mathematics or science classes are being taught by teachers without a relevant qualification, it may affect the quality of subject-specific instruction ÔÇö particularly important for ATAR subjects in Years 11 and 12.
The Finances Tab: Where the Money Comes From
Many parents are surprised to discover that school funding data is publicly available on MySchool. The Finances tab shows:
- Total net recurrent income per student
- Breakdown by source: Australian Government, state/territory government, and private sources (fees, fundraising)
This is useful for understanding the financial context of a school. A private school with a high income per student typically has more resources for facilities, extracurricular programmes and specialist teachers. However, many government schools with lower per-student funding still deliver outstanding educational outcomes ÔÇö particularly in areas with strong community involvement and experienced teaching staff.
How to Compare Two Schools Side by Side
MySchool includes a built-in comparison tool that allows you to evaluate two schools simultaneously. To use it:
- Search for and open the first school's profile.
- Click the "Compare this school" button (usually located near the top of the school profile).
- Search for the second school in the comparison panel.
- Both schools' data will appear side by side across NAPLAN, Students, Staff and Finances tabs.
This feature is extremely useful when you are deciding between two or three shortlisted schools and want to see differences in NAPLAN performance, attendance or funding at a glance.
What MySchool Does NOT Tell You
While MySchool is a powerful tool, it is important to understand its limitations. Data on the platform does not capture:
- School culture and ethos ÔÇö whether students feel safe, valued and inspired
- Quality of individual teachers ÔÇö staff numbers tell you little about classroom dynamics
- Extracurricular programmes ÔÇö sports, arts, clubs, leadership opportunities
- Community and parental engagement
- Specialised programmes ÔÇö music academies, gifted student streams, language programmes
- Actual student happiness and wellbeing
For these reasons, MySchool data should always be used alongside school visits, conversations with current parents, and direct engagement with school leadership. Data informs ÔÇö it does not decide.
For a broader comparison of school types in Australia, read our guide: Public vs. Private vs. Catholic Schools: Key Differences and How to Choose. You can also use our School Comparison Tool on Australian School Finder to explore schools by location and type.
Practical Tips for Using MySchool Effectively
- Look at trends, not snapshots: View NAPLAN data over multiple years. A single year can be an outlier; three to four years of consistent improvement tells a more reliable story.
- Use the ICSEA filter: Always compare schools with similar ICSEA values for a meaningful academic comparison.
- Check attendance rates: Attendance above 90% is a proxy for student engagement and school culture.
- Don't ignore the Staff tab: Out-of-field teaching rates and staff stability matter, especially in secondary school.
- Cross-reference with school websites: MySchool gives you data; school websites give you vision, values, and programmes.
- Book a school tour: No amount of data replaces a 45-minute visit to see the school in action.
MySchool and the NAPLAN 2023 Reforms
In 2023, NAPLAN underwent its most significant reform in over a decade. The test was moved from May to March, and the reporting scale changed from numerical bands (1ÔÇô10) to the four proficiency levels described above (Exceeding, Strong, Developing, Needs additional support).
This means that if you are looking at historical MySchool data before 2023, the results are presented in a different format. ACARA provides transition guidance on the site, but be aware that pre-2023 and post-2023 scores cannot be directly compared ÔÇö the methodology changed. Focus on data from 2023 onwards for a consistent picture under the new framework.
To understand more about what NAPLAN is and how it works, read our dedicated guide: What is NAPLAN? A Parent's Guide to the National Assessment Program.
Step-by-Step: A Sample School Research Process
Here is a practical workflow you can follow when researching schools for your child using MySchool:
- Identify 3ÔÇô5 candidate schools in your area using our Australian School Finder search tool.
- Look up each school on MySchool and note their ICSEA value.
- Compare NAPLAN results against statistically similar schools ÔÇö not national averages.
- Check attendance rates ÔÇö aim for schools consistently above 90%.
- Review the Staff tab for out-of-field teaching rates (critical for secondary schools).
- Use the comparison feature to place your top two schools side by side.
- Visit each school, meet the principal, and speak with current parents.
- Make your decision based on data + gut feeling + your child's specific needs.

Frequently Asked Questions
Is MySchool data updated every year?
Yes. MySchool is updated annually, typically between September and October, after NAPLAN results are finalised and financial data is submitted by schools. Some data sets (such as staffing or enrolments) may be updated on slightly different schedules.
Can I compare more than two schools on MySchool?
The built-in MySchool comparison tool allows you to compare two schools at a time. For broader comparisons, you can use the Australian School Finder comparison tool, which allows multi-school comparisons with additional filters.
What is a good NAPLAN result on MySchool?
Under the 2023 framework, a good result means a high percentage of students in the "Strong" or "Exceeding" proficiency levels. More importantly, a school performing above its statistically similar schools benchmark is demonstrating strong academic value-add for its community.
Does a high ICSEA score mean a school is better?
No. ICSEA measures the socio-educational background of a school's student community, not school quality. A school with a high ICSEA value draws students from more advantaged backgrounds ÔÇö which generally correlates with higher NAPLAN scores ÔÇö but this does not mean the school is "better" than a lower-ICSEA school achieving similar or greater outcomes for its students.
Is MySchool the only way to research Australian schools?
No. MySchool is one important resource, but you should also consult school websites, visit schools in person, read parent reviews, and use tools like Australian School Finder to search and compare schools by location, type and education level.
Find the Right School for Your Child
Use Australian School Finder to search, compare and explore schools across every state and territory in Australia.
Search Australian Schools 